Google NGram Viewer
The Google NGram Viewer is often the first thing brought out when people discuss large-scale textual analysis, and it serves nicely as a basic introduction into the possibilities of computer-assisted reading.
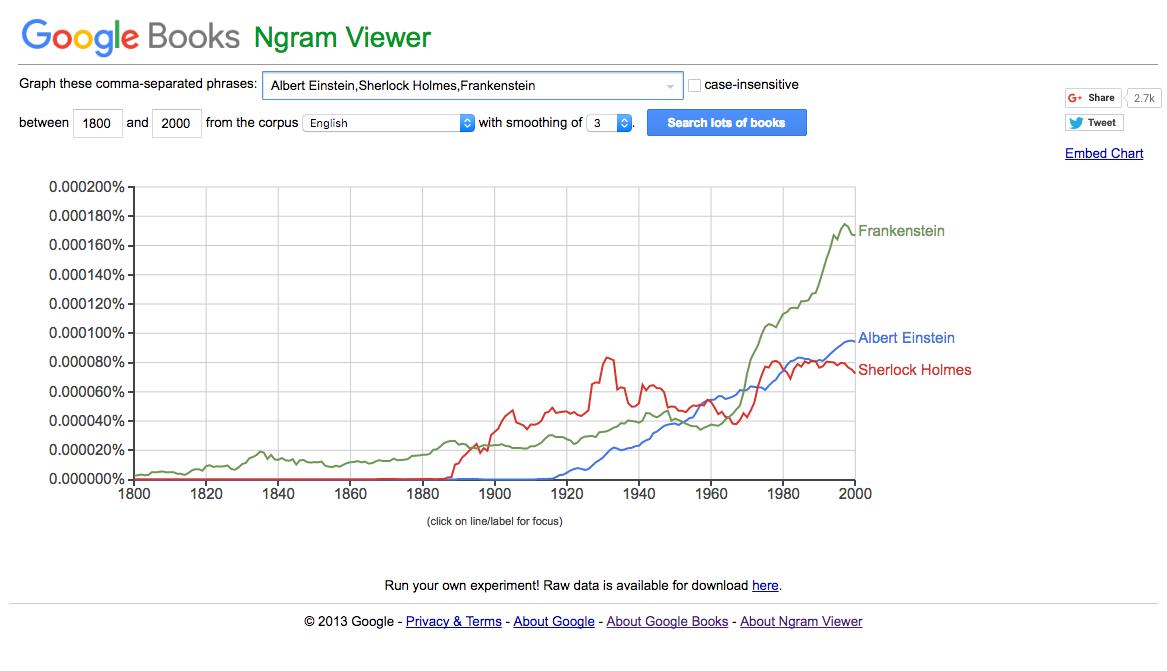
The Google NGram Viewer provides a quick and easy way to explore changes in language over the course of many years in many texts. Provide a word or comma-separated phrase, and the NGram viewer will graph how often these search terms occur over a given corpus for a given number of years. You can specify a number of years as well as a particular Google Books corpus.
The tool allows you to search hundreds of thousands of texts quickly and, by tracking a few words or phrases, draw inferences about cultural and historical shifts. If we search on ‘science’ and ‘religion,’ for example, we could draw conclusions about their relative importance at various points in last few centuries.
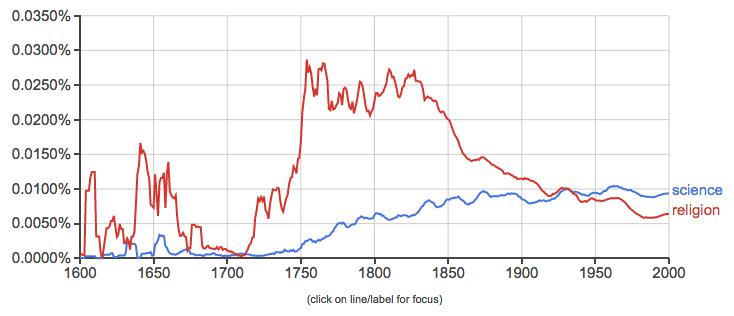
Looking at the graph, one could see evidence for an argument about the increasing secularization of society in the last two centuries. The steady increase of usage of the word science over the last 200 years accompanied by the precipitous decline of the word religion beginning in the mid-nineteenth century could provide concrete evidence for what might otherwise be anecdotal. But not so fast: what is actually being measured here? We need to ask questions about a number of pieces of this argument, including ones regarding:
- Corpus
- Methodology
- Interpretation
Corpus
With any large-scale text analysis like this, the underlying data is everything. Imagine running the same word search for ‘science’ and ‘religion’ over 1000 texts used in religious schools or services. It would probably look quite different! The same would hold true if we targeted only biology, botany, and physics textbooks over the same time period. While these are fairly stark examples, the same principle holds true: the input affects the output. The data we choose for a study can skew our conclusions, and it is important for us to think carefully about their selection as a part of the process.
-
What is the corpus, or set of texts, being used to generate this data?
-
Where is this data coming from?
The Google NGram Viewer offers a dropdown menu where you can select a corpus to study. Our results would look a lot different depending on which corpus we selected. The corpora for these options are pulled from the Google Books scanning project (to see similar visualizations of your own corpus, you could try working with Bookworm, a related tool). This raises a number of difficulties. As Eitan Adam Pechenick, Christopher M. Danforth, and Peter Sheridan Dodds have noted, the corpus only has one copy of each book in its dataset. So things do not get scaled for circulation or popularity. A book that only sells one copy is weighted the same as a book that sells a thousand copies: they are both a single copy according to Google’s methods.
The Google Books corpus has also, at times, been criticized for its heavy reliance on poor quality scans of texts to generate their data (more on this in later chapters). The computer can’t infer, for example, that the mispelling ‘scyience’ should be lumped in with the results for ‘science.’ Any underlying problems in scanning or uploading texts will skew the results. In addition, the results are better after 1820. There were far fewer books published before then, and even fewer are on Google Books.
As Ted Underwood suggests, when approached with a healthy sense of skepticism, many of these issues do not discount the use of the tool for “relative comparisons between words and periods” after 1820 or so. We can’t know direct truths through the viewer, but we can still use the data for analysis. For now, just remember that graphs can appear to express fact when, in fact, the data is murky, subject for debate, or skewed.
Methodology
Even with a perfect corpus, our choices can make a big difference in the results we produce. The above search only accounts for single words, but there are more nuanced ways of using the NGram Viewer. An n-gram is another name for a sequence of words of length n. Take this short phrase:
‘a test sentence.’
We have three n-grams of length 1 (“a”, “test” and “sentence”), two n-grams of length 2 (“a test” and “test sentence”), and 1 n-gram of length 3 (“a test sentence”). Or, we could use shorthand: we have 3 unigrams or tokens, 2 bigrams, and 1 trigram. These are just fancy ways to describe different ways of chunking up a piece of text so that we can work with it. And we can do the same thing in the NGram Viewer. Take this NGram for the token ‘scandal’ in an English corpus:
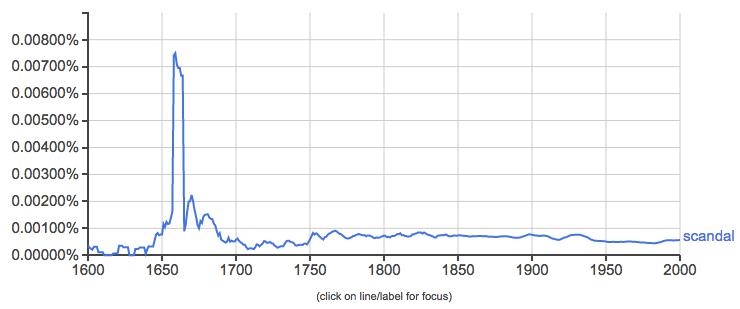
It appears like something fairly dramatic happened around 1660 that caused a massive spike in the usage of ‘scandal.’ This in itself could be significant, but we might be interested in more nuanced readings of this data. We might want to see, say, bigrams containing scandal like ‘political scandal’ and ‘religious scandal’ to observe when certain types of scandals come into prominence. The NGram Viewer allows for a number of nuanced searches that you can read about here. For now, let’s try out a wildcard search - ‘* scandal’:
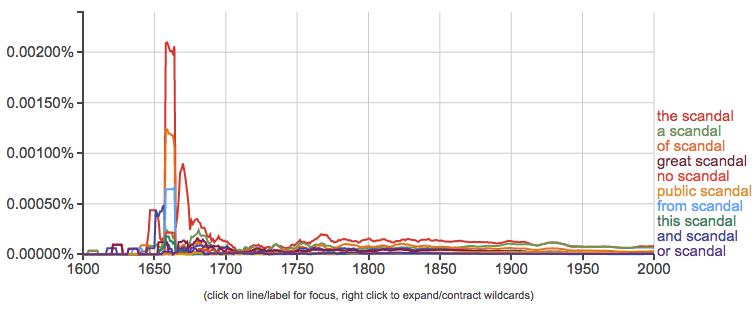
The asterisk in searches like this matches anything, so it will return all two-word phrases containing ‘scandal’ as a second word. And, handy for us, it will show us the top ten uses. In this case, they’re almost all articles or prepositions: ‘the scandal,’ ‘a scandal,’ ‘of scandal,’ etc. And they all seem to spike around 1660 as well. We would need more information about this time period to tell exactly what is going on here, and to do so we might want to specifically exclude these common usages. Given the relative unreliability of N-Grams before 1820, this dramatic uptick might be due to just a few works that used the term “scandal” around this time – and might not be representative of larger patterns.
We might also want to look at different forms of the same word. After all, the above search only captures the singular form of ‘scandal’, but any word can occur in multiple forms over the course of a corpus. The NGram Viewer can account for this as well:
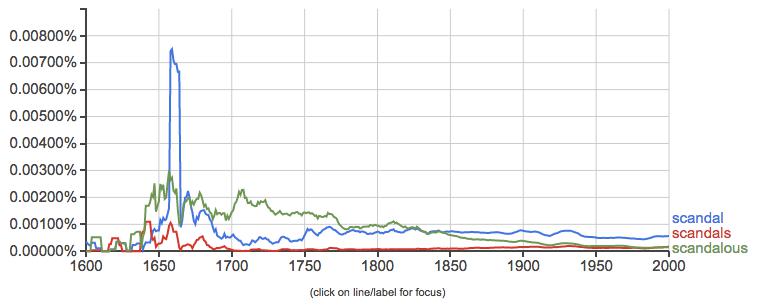
That massive spike we see in the use of ‘scandal’ is not quite matched by other forms of the word. In particular, the adjective form ‘scandalous’ enjoys more usage until the mid-nineteenth century. Maybe scandal as a noun, as an idea, as a thing unto itself explodes onto the scene in the mid-nineteenth century, wereas before it was something more a thing attached to other people, places, and events.
To drill down more deeply into another term relevant to this course, check out this ngram of the word ‘crime’ in the English corpus:
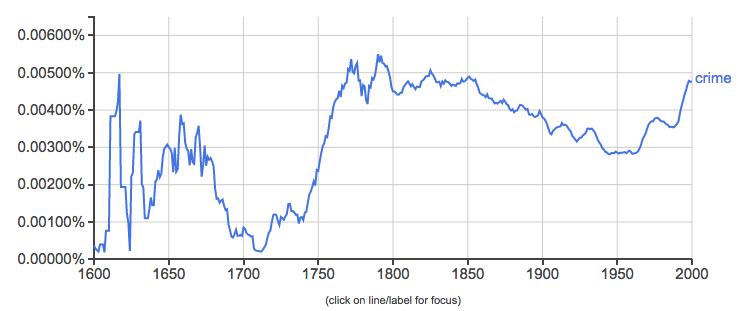
According to this chart, after a drop during the early-eighteenth century, English writers discussed crime more consistently and ubiquitously than ever before. But what about authors writing in other languages? Here is the same search in French.
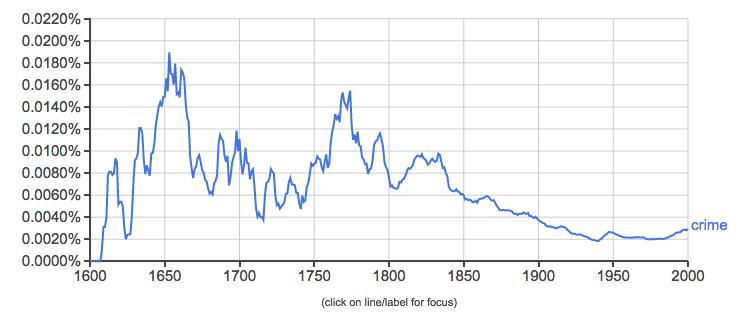
The general trend of more mentions of crime in the 19th century than the 20th holds true in both the French and English corpora. However, if you pay careful attention to the y-axis you will note that French authors actually are mentioning crime far more frequently relative to the rest of the writing at the time. The trends are similar, but the percentage of times ‘crime’ shows up is much higher in France. In England during this time, uses of the word hover around 0.0045. French writing mentioning ‘crime’ is over double that percentage during the same period, and it does not dip down to that number until 1880.
You will also note a different trajectory to these two N-Grams. In the English-language corpus, mentions of “crime” go down gradually over the course of the nineteenth century. In contrast, there is a big spike in the French corpus which starts going down quite dramatically in the 1830s. When you read portions of Louis Chevalier’s Laboring Classes and Dangerous Classes in Paris during the First Half of the Nineteenth Century later in the term, you’ll get a sense of why this interest in crime surges in the early nineteenth century and then dies down.
If we were using N-Grams for more than just a demonstration, we would want to do a lot more research and thinking about both language and history. For instance, in the above example, is the fact that French authors seem to be using “crime” more often than English-language ones due to a difference in language and usage? Perhaps English authors often use a synonym for crime, whereas French ones do not? Or does it reflect the fact that French authors were more concerned with crime than English ones?
Or, let’s say we were interested in history of scientific racism in European and American thought. In that case, we might want to know about the trajectory of the word “race” over time.
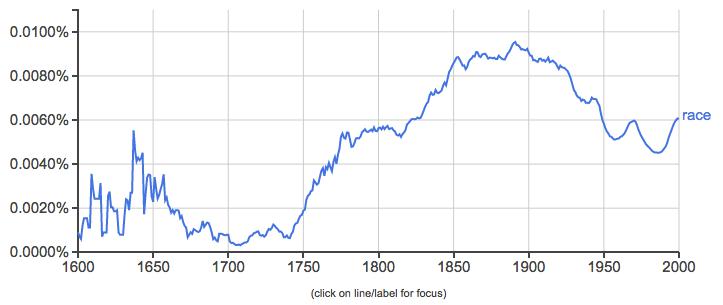
This N-Gram shows an increasing use of this term over the course of the eighteenth and nineteenth century, peaking around 1890 and then gradually declining in the twentieth century, albeit with some upswings. On the one hand, scientific racism had one of its heydays in the late nineteenth century, so maybe this N-Gram shows this historical trend. But as soon as you think more about this topic, you would realize that it’s a lot more complicated that this. For one, it might strike you as a little odd that the line dips in the late 1950s and early 1960s, an era when the Civil Rights movement was emerging. Were people really writing less about race then than before? Alternatively, the term “race” can mean a lot of different things; in this case, the results we are interested in (the categorization of people according to their phenotypes) are undoubtedly getting jumbled in with references to sporting events and elections. And as soon as we started doing research on the history of scientific racism, we would learn that writers used the term “race” to refer to groups of people in different ways in the eighteenth century than they did at the end of the nineteenth century. We would also want to think about terms that are associated with or used as synonyms for race. Maybe authors in the twentieth century were using other words to talk about race? If so, what might those be?
So, language changes over time. A single word might radically change in usage over the centuries in ways that skew our results. We also use different terms over time to describe the same phenomena. These are all things we would want to say a lot more in any interpretations using N-Grams. We would also need to consider what they can (and cannot) tell us and think about potential problems in my reading. But hopefully the implications of the technology will be exciting to you nonetheless.
- Digital methods can allow us to make observations about vast numbers of texts. Far more than you would be able to read yourself.
That last phrase should cause some alarm: we haven’t actually read any of these texts, but we are making observations about them nonetheless. We hope you will think deeply about the implications about such an act.
- What does this form of reading lose?
- What does it gain?
- How it can it be approached in ways that minimize the former and maximize the latter?
Interpretation
Of course, these graphs mean nothing on their own. It is our job to look at the results and describe them in meaningful ways. But be critical of what you see. You might find something interesting, but you might be looking at nonsense. It is your job to tell the difference. Beware of apophenia, the all to human urge to look at random data and find meaningful patterns in it. You can find wild patterns in anything if you look hard enough. After all, visualizations can confuse as much as clarify. Numbers and graphs do not carry objective meaning. Miriam Posner summarized it pithily on Twitter once:
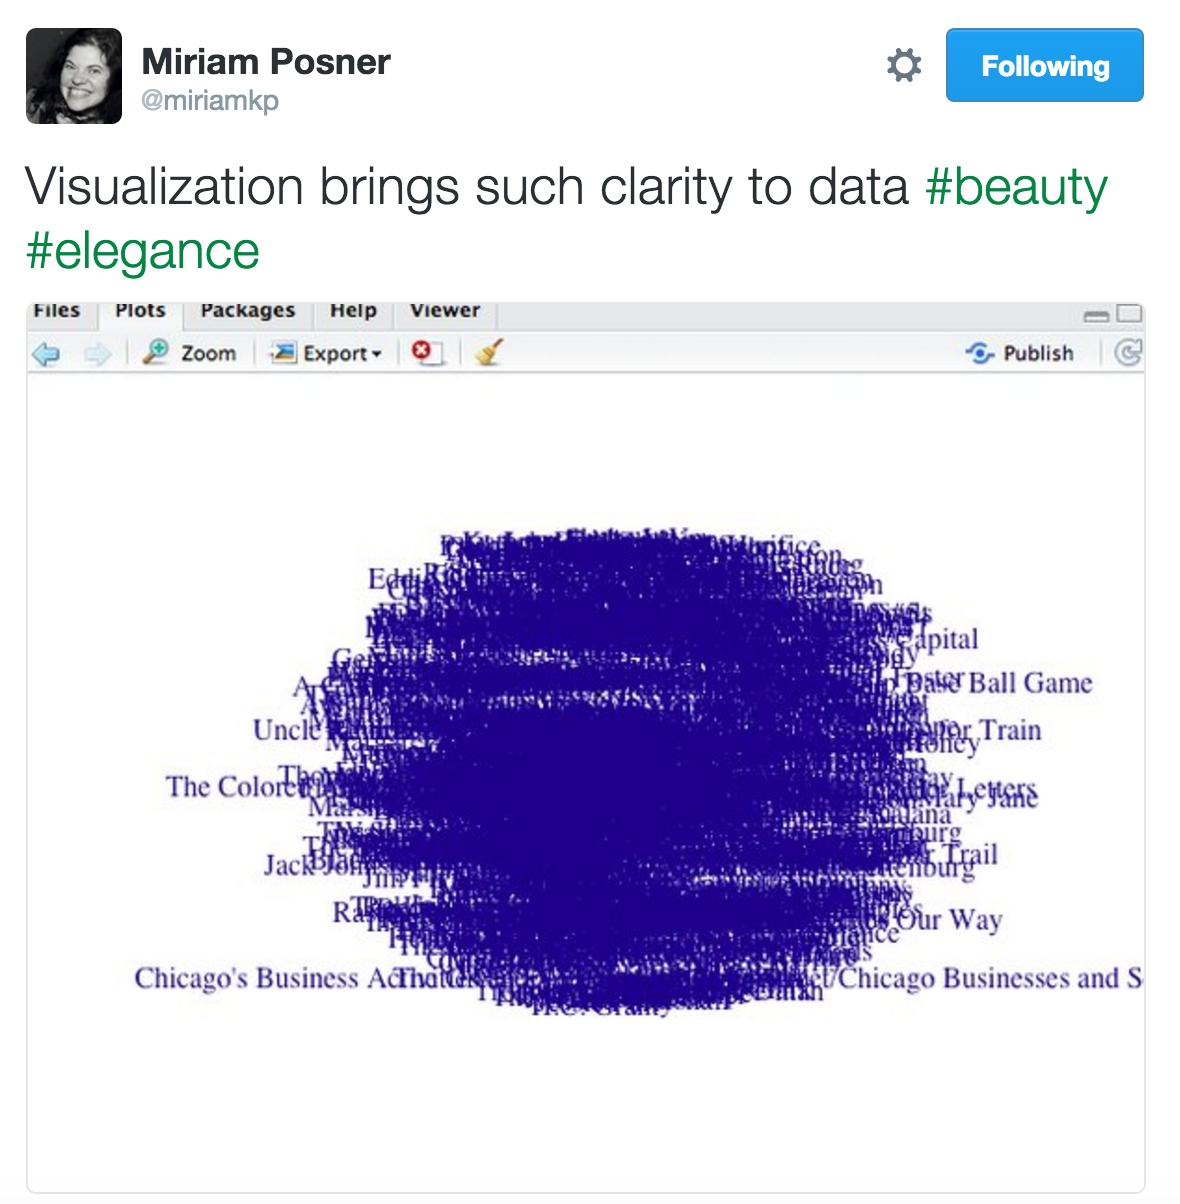
Always think. Never let a graph think for you.
Further Resources
- Ted Underwood on “How not to do things with words” for helpful criticisms of studies employing the Ngram Viewer.
- Danny Sulivan on “When OCR Goes Bad: Google’s Ngram Viewer & The F-Word” for more on Google NGram and OCR.
- Geoff Nunberg on “Google Books: A Metadata Train Wreck” for more problems with the viewer.