Sentiment Analysis in Action
To illustrate how sentiment analysis works, let’s walk through a couple different projects. We will do a fair amount of handwaving at technical details, but hopefully you will get a sense of the kind of work that goes into sentiment analysis projects.
Jockers and Syuzhet
Matt Jockers has been working on using sentiment analysis to discover plot trajectories in fiction in just the same terms as the video in the previous lesson (indeed, Jockers’s writing is what pointed us to the Vonnegut clip in the first place!). By taking thousands of texts and classifying their sentences for sentiment, he has developed a software procedure for tracing plot trajectories and suggested that there are only six or seven different plot shapes based on this type of analysis. Jockers’s bold claim has since come under serious critique by Joanna Swafford, who argues that the shapes are the results of configurations in Jockers’s software rather than of any inherent quality in the text (also a recurrent theme throughout this book!).
Let’s take a closer look at how Jockers is able to make such a claim. He uses a sophisticated software package that he constructed in the R programming language. We won’t get into the details of the code itself, but we can cover the general approach. To find a more technical explanation you can look at Jockers’s “Introduction to the Syuzhet Package.”
Jockers’s project combines supervised classifiers and unsupervised classifiers. Remember: supervised classifiers rely on training data that tells the software how to interpret and classify data. Unsupervised classifiers are not based on any prior training data. Instead, they rely on underlying assumptions and algorithms to categorize texts (in the case of topic modeling, this means that the unsupervised classifiers make assumptions about the relation between texts and statistics). We will focus on the supervised portion of his work below.
So, first, Jockers needed training data. In order for his software to read sentiment in sentences, it needed example sentences that had already been marked for emotions. By providing the software with example sentences, the software will be able to categorize related sentences in the future. So imagine that we train our computer with these sentences:
- “I am happy!”, positive
- “I am sad!”, negative
Later, we fire up our classifier and ask it to mark a given text for sentiment. Imagine that the computer encounters sentence 1 again later in the text. The computer could look in its bank of knowledge and remember that it should be marked as positive. But this classifier would not work very well: it only knows the sentiment for two specific sentences. When it encounters new sentences that we haven’t pre-marked, it would not know what to do. In practice, we want to train a classifier on as much as data as possible to maximize its ability to handle new information. And we probably won’t train it on full sentences. After all, computers distinguish between sentences and individual words in quite profound ways (we talked about this in “How Computers Read”). Depending on how thorough we want to be, we might give the computer vocabulary and phrases marked for sentiment instead. Since working with numbers gives us more options for graphing things, we might use “1” and “-1” to represent sentences with positive and negative values. And rather then a binary positive/negative, we might mark for a continuum: numbers between -5 and 5, say. After all, ‘good’ is less positive than ‘exuberant.’ So each word or phrase gets converted into a series of positive and negative numbers.
You can find information on the training sets used by Jockers here. He uses a training lexicon of his own but gives the option to categorize sentiment using other training sets. Basically the software reads a text, looks at its memory of the training corpus to determine how positive or negative a sentence or word is, then converts the text into a series of values like this:
2.50 0.60 0.00 -0.25 0.00 0.00
Now the text is converted into a series of values that represent the sentiment of the text. As the numbers of the text becomes negative or positive, we get a sense of how the classifier reads the emotions of the text. From there, it is just a matter of plotting numbers to get a better representation of the sentiment trends over time. In the end, we can get something like this graph for James Joyce’s A Portrait of the Artist as a Young Man, taken from Jockers’s explanation of the software:
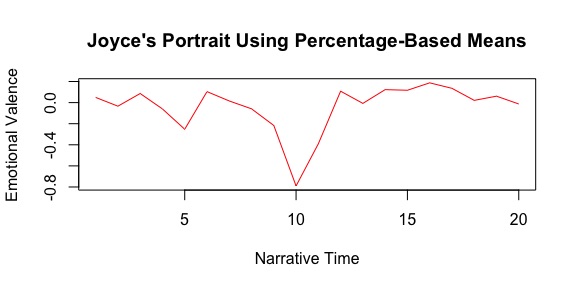
Just like we did with Voyant, Jockers breaks the novel into a number of segments and aggregates the sentiment for each section to get a sense of how the emotion changes over time. At its core, measuring sentiment computationally in this way relies on solid training data. The computer needs to learn how to map emotion-laden words and phrases onto some sort of numerical system. The robustness of your training set can strengthen or complicate your results. Getting a good training set can be difficult, however, since assembling one takes a great deal of time and labor. Notably, it is a lot of work to manually label single words with positive or negative valence. With a series of values like these for each text, Jockers then has a basis for comparison among his whole corpus. He can start to look for patterns in plot trajectories, which eventually leads to his claim that there are only a set number of plot arcs for novels.
EmojiSentiment
Another interesting use of sentiment analysis is EmojiSentiment. The project approaches the problem from a different angle: rather than trying to analyze textual content for sentiment, the site postulates that emojis embedded in tweets might be a good predictor of their sentiment. There are only around 2000 emoji and only a small subset have emotional valences to them; tagging these emojis is a lot easier than tagging all the words that convey emotion. The authors of this project use emojis to determine the overall sentiment for particular hashtag, as opposed to any one tweet. The project postulates that if you gather up all the emoji associated with a particular hashtag, you will get a pretty good sense of the emotional valence for that stream of conversation. For example, EmojiSentiment reads #friday as being relatively positive:
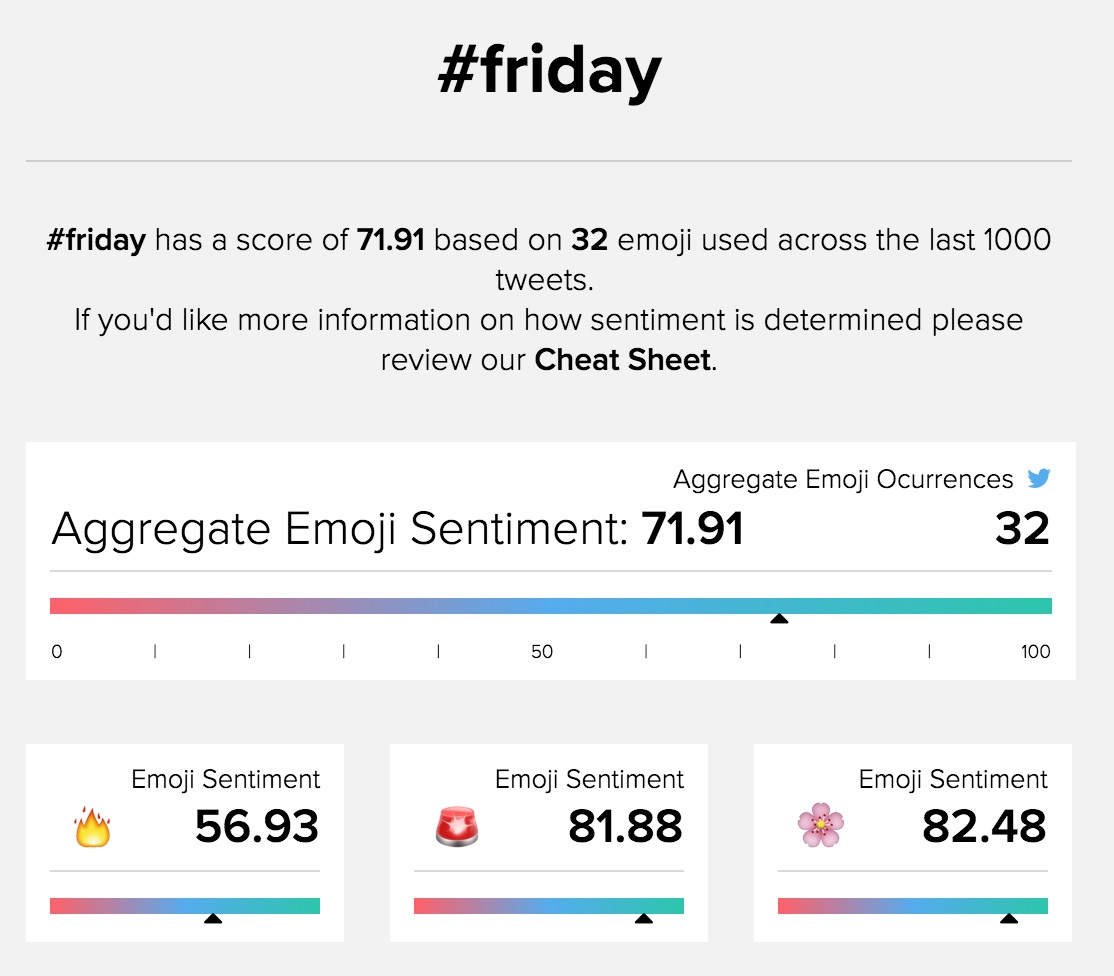
On first blush, this makes sense. Everyone gets excited for the weekend. But look more closely. The three most dominant emoji are fire, police sirens, and flowers, which might seem a bit unusual. Note that we’re only getting 32 emoji in the last 1000 tweets - these might just be artifacts of whatever is going right now, and the project can’t handle more volume than that (it’s a student project. Yay students!). So our sample size is rather small and could easily be skewed by a handful of active users. We would want far more emoji to really get a good measurement of sentiment. If #friday got a relatively happy average sentiment, #angry is much more negative:
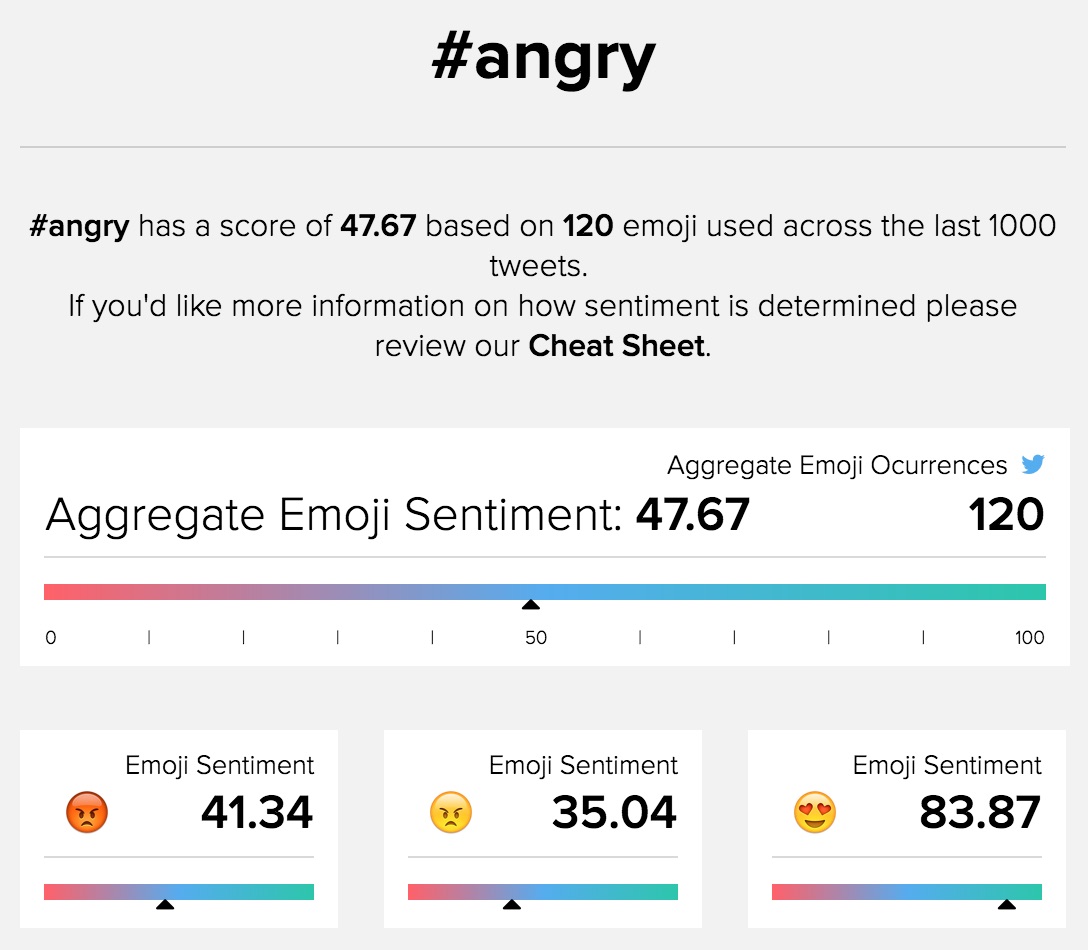
Note how even #angry just barely dips below 50 to be predominantly negative. We actually had to search around for a while to find a hashtag that read as predominantly negative. Could this be a function of language - are people just happier than they are sad? Certainly not. This might have to do with how we represent our emotions on social media; maybe we don’t use emojis to represent negative emotions that often. Or maybe sentiment analysis by way of computation is imprecise at best. To improve on this project, we would want to scale it up to read vastly more data. We might then use the emoji a tad differently. Instead of using them to measure sentiment, you could use them to train the sentiment classifer further so that it refines itself over time! All of this would require far more funding than the EmojiSentiment team has, however, and the tool is a great provocation as it stands.
-
What might you imagine using sentiment analysis for?
-
What kinds of texts lend themselves especially well to reading for emotion?