Personal Data Story
24 Mar 2025 Posted in:digital humanities talks pedagogy I just gave a workshop online for Dr. Jennifer Isasi’s course at Pennsylvania State University. Normally I would share the text I used for events like these, but since it was a workshop I don’t quite have something formal to share in that mode. The abstract and title I provided for the event can give some flavor of things:
Organized Chaos: Humanities Data and Cleaning with a Purpose
This workshop covers the theory and practice of preparing humanities data for analysis. Even while being notoriously difficult to work with, we will explore how the mess of humanities data is actually what conveys a wealth of information. We will discuss the affordances and tradeoffs inherent in data cleaning with the humanities, when it is worth doing, and when it is worth maintaining a sense of organized chaos that our materials demand. Practical discussions will include working with dates, irregular spellings, and data organization. We will use OpenRefine to practice working with data and use examples drawn from the real world. Participants should come to the workshop with OpenRefine installed on their computer.
So basically, the broad point of the workshop was that data cleaning in a humanities context can best be thought of as a kind of organizing of many possibilities, as living with chaos rather than trying to eliminate it. Your data will never really be “clean,” per se, no matter how much you try to pursue those ends. And in trying to impose an order that does not exist in reality you eliminate a lot of important cultural and linguistic differences that we as humanists care about quite a bit. All of this was a layer over what was essentially a workshop on Open Refine, a fabulous open-source power tool for working with messy data. You can find my slides at this link.
While I don’t have a full text worth sharing, I do think that there is one piece of the workshop that worked especially well that I wanted to document. As is often the case, at the beginning of our time participants introduced themselves to me and to each other. Dr. Isasi helped fill in gaps about who the people in the room were, where they were from, and what they work on. Dr. Isasi then read my bio, which is always an uncomfortable moment for me. I never quite know what to do while someone is talking about me in this way or how to transition gracefully from that discomfort to the topic at hand. This time I decided to sit in that space a bit longer and tie it directly to what we were doing by having the first phase of the workshop address what I called my “personal data story.”
I began by sharing an internet search for my name and asking students what they made of it:
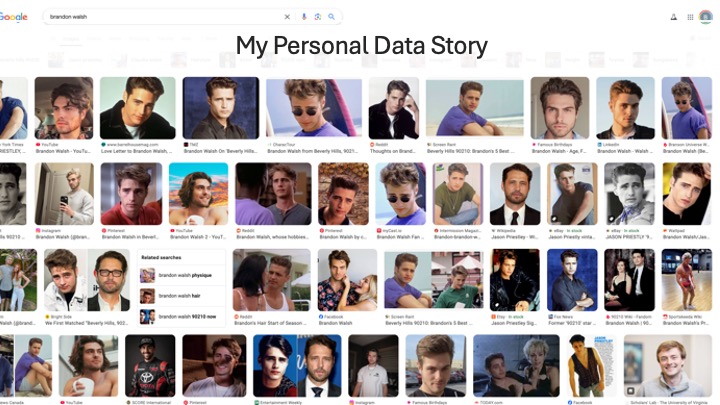
If you were alive at a certain point in the 1990’s, you likely already know the answer to what you are looking at. I share my name with a particular character from the Beverly Hills, 90210, a popular TV show that premiered in 1990. I have been haunted by this data point my whole life. My earliest memory of it was in kindergarten, but as recently as last year someone started laughing the moment I spoke my name while trying to book a doctor’s appointment [Update: between drafting and publishing this post a faculty member from a different department pointed the connection out again!]. The workshop participants very quickly recognized that there was more than one Brandon Walsh out there in this particular dataset. I pointed to this as an example of how messy data can be when we’re dealing with people. How do you represent these differences in a data set? It can get complicated quite quickly. I also took the moment to point out that I’m slowly creeping up in the search engine optimization. If you zoom out several times, I finally show up at the very bottom of the page. I’m coming for you, Brandon Walsh.
As the next stage of my data journey, I asked participants to consider a particular piece of mail that I’ve been getting my whole life.
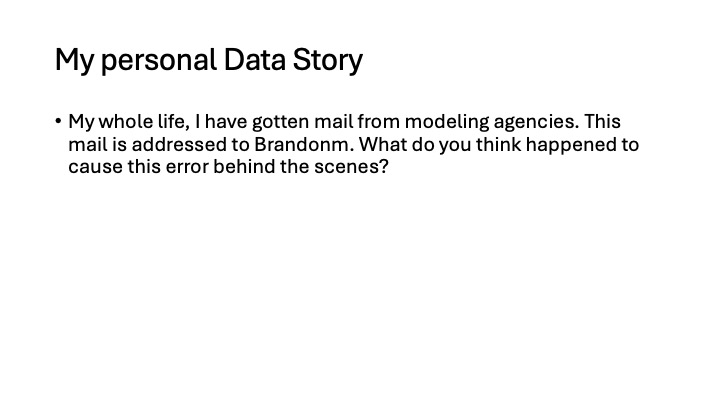
My whole life I’ve been getting mail to a particular person named Brandonm, all one word, from modeling agencies asking me to come in and do runway shoots. It started when I was in elementary school. Every few years I will I think I’m finally free and forget about it. But then I’ll get a fresh call asking me to come in. I asked the participants to guess what they thought might be going on. They immediately had the same thought I did, as someone asked, “does your middle name start with the letter M?” It does indeed. My middle name is Michael, and I would be willing to bet money that someone accidentally merged two columns in a table at some point. Brandon M Walsh became Brandonm Walsh, and a star was born. In the context of this particular workshop, I found it interesting for the way in which this story shows that data errors can follow you your whole life whether you realize it or not.
For the last stage of my data journey, I gave the participants a more technical exercise. Not about me, per se, but rather about a particular kind of data problem that was quite pivotal to one stage of my life.
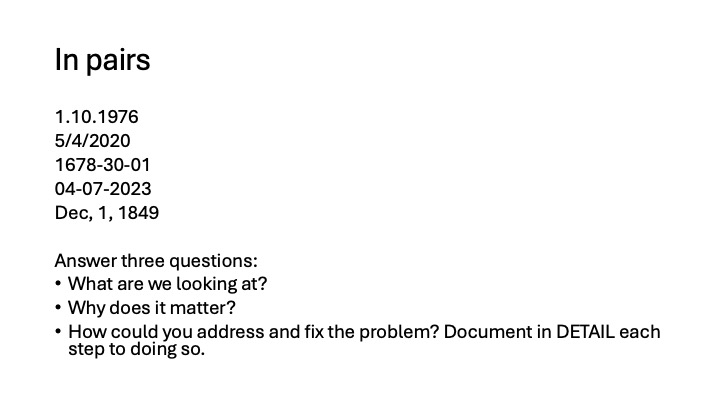
I presented five pieces of data to the participants and asked them a series of questions:
- What are we looking at? What are these things in front of you?
- What’s going on with them?
- And then, if you cared about such things, how would you correct them?
The data in front of the group, of course, consisted of dates in a variety of different formats. These are the sort of thing that can be quite confusing, especially if you’re talking to people from different geographic locations, different cultural contexts. The most confusing are the two formats that interchange day and month but keep the year in the same place. The participants described how they would first decide on a standard and then convert each date one at a time to conform by moving digits around and editing the punctuation separating things. I then revealed the trick of this prompt: this was actually a real-life job interview question I got when I was interviewing for a programming position at the University of Virginia Library. And I think it’s a really good example of a technical question that one might get in an interview. You have to think through a problem, talk about how you would solve it, and display a lot of technical understanding. But you don’t have to actually write any code on a whiteboard. If I recall correctly, my own response was “these are dates that are formatted incorrectly, and I would start by using regular expressions to try and work out how to massage the dates into a particular format. Otherwise it can make data processing and computational work quite challenging, if not possible.”
I use this technical question all the time in mock interviews because it’s easy to remember. In the context of this particular workshop, it also served as a good pivot from the individual, personal stakes of data management to the ways the same questions might arise in a real-world professional context. At this point, the participants quite wisely began to make connections to Katie Rawson and Trevor Muñoz’s piece entitled “Against Cleaning.” In that piece, Rawson and Muñoz discuss the need to preserve the cultural context of data. Rather than cleaning away difference, the students suggested that we actually add a second column for the new, cleaned data fields as we work through them. In this way, we would preserve the original information while also gaining a new set of material that we could use for computation. Adding data rather than taking away difference.
There’s more in the slides if you’re interested. The workshop drew heavily on the work that I have been doing in my class this semester on “Data for the Rest of Us.” I’ll keep sharing more about that work in the future.